
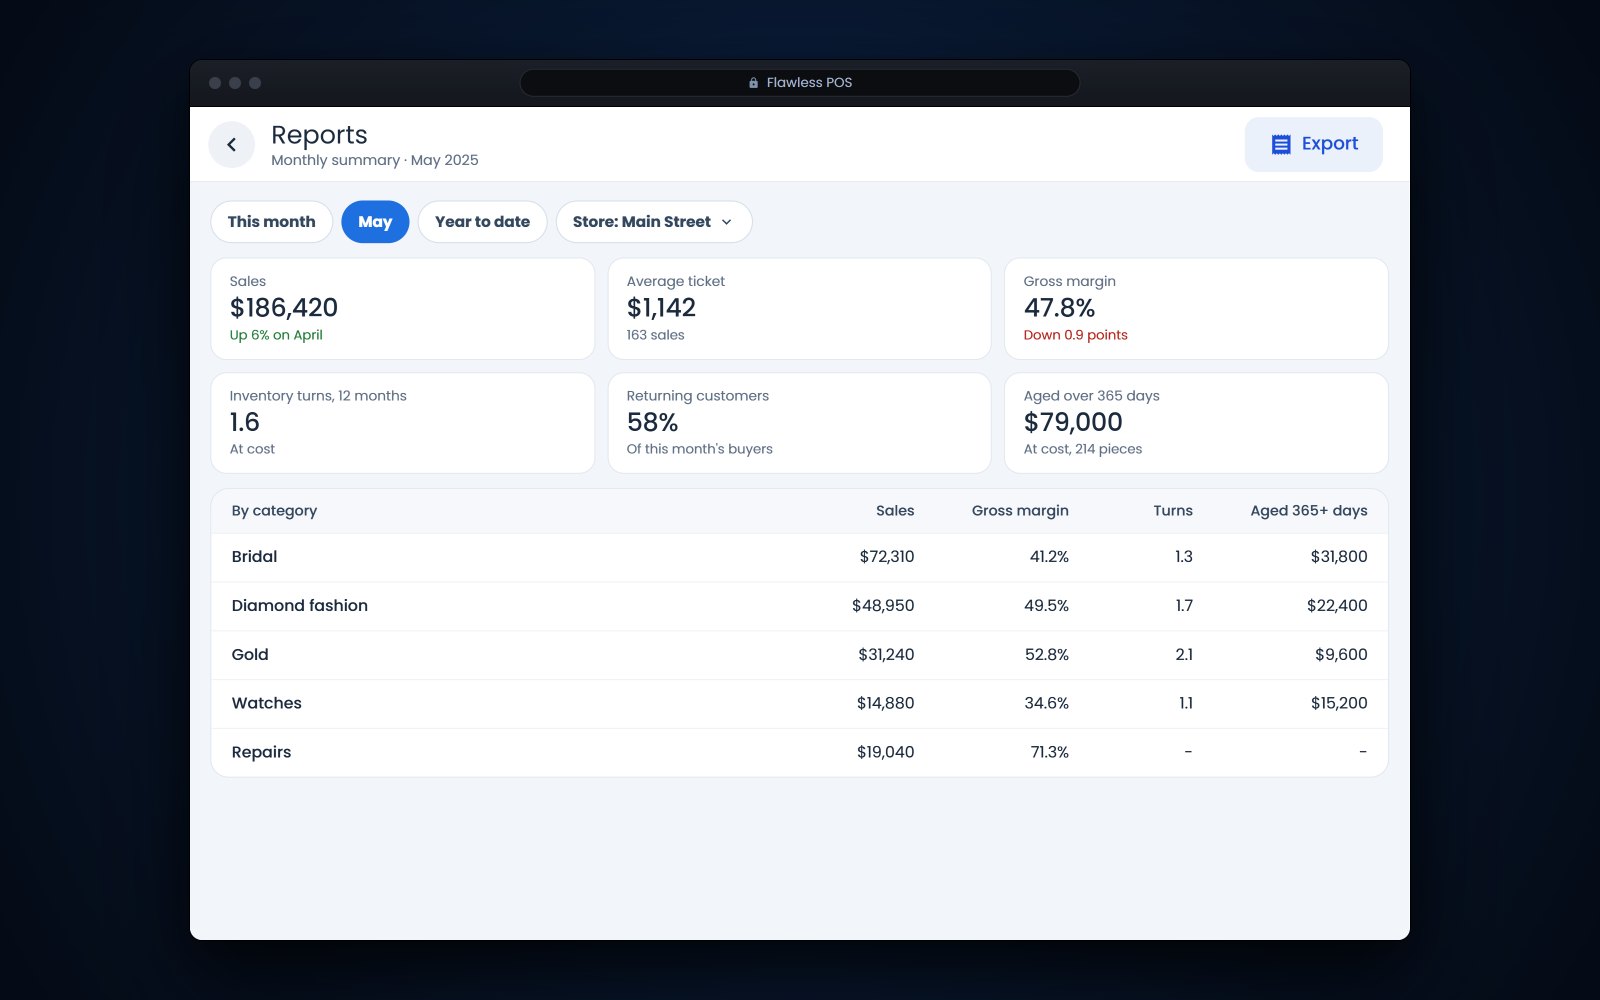
Short answer: The jewelry store KPIs worth checking every month are sales per day, average ticket, gross margin by category, inventory turnover by category, aged inventory, repair revenue and turnaround, returning-customer share, sales by salesperson, open special orders and layaways, and online versus in-store sales. Compare each one with the same month last year and with your own 12-month trend. Store mixes differ too much for industry averages to make good targets.
In this article
- How to read jewelry store KPIs each month
- Sales per day, average ticket and gross margin by category
- Inventory turnover and aged inventory
- Repair revenue, turnaround and returning customers
- Sales by salesperson, special orders and layaways
- Online versus in-store sales
- Common mistakes when tracking jewelry store numbers
- How Flawless POS helps you track these numbers
- Frequently asked questions
How to read jewelry store KPIs each month
Say it's the first Monday of the month. You have half an hour before the store opens, last month's reports and a cup of coffee. That's enough time to check the 10 numbers below, if you look at the same ones every month and write down one thing you'll do about each.
Compare each number with the same month last year, because jewelry is seasonal. December and the weeks before Valentine's Day and Mother's Day distort any month-to-month comparison. Then look at the 12-month trend. Use the same definitions every time, for example net sales after returns and discounts, before sales tax.
| # | KPI | How to calculate it | Watch for |
|---|---|---|---|
| 1 | Sales per day | Net sales divided by days open | Change from the same month last year |
| 2 | Average ticket | Net sales divided by number of sales, with repairs counted separately | A drop while the number of sales holds |
| 3 | Gross margin by category | Sales minus cost of goods sold, divided by sales | Gold and other metal categories |
| 4 | Inventory turnover by category | 12 months of cost of goods sold divided by average inventory at cost | A falling trend |
| 5 | Aged inventory | Cost of pieces older than 180 and 365 days, as a share of inventory at cost | Growth in the 365-day group |
| 6 | Repair revenue and turnaround | Monthly repair revenue and average days from intake to ready | Jobs past their promised date |
| 7 | Returning-customer share | Sales to repeat customers divided by sales with a customer attached | Tickets with no customer |
| 8 | Sales by salesperson | Net sales, margin and average ticket per person | High sales with low margin |
| 9 | Special orders and layaways outstanding | Count, total value and deposits held | Late orders and missed payments |
| 10 | Online versus in-store sales | Website sales divided by total sales | Online stock that doesn't match the cases |
A 30-minute monthly routine
- Pick a fixed dayFor example, the first Monday of the month, before opening.
- Pull the same reportsSales, inventory, repairs and customers, for the month just closed and the same month last year.
- Fill in the sheetOne row for each KPI and one column for each month.
- Write one action for each number that movedWho does what by when, such as reorder 2 styles or call 3 vendors about late orders.
- Check last month's actionsStart the next review by seeing whether last month's actions got done.
Tip: Keep the numbers in one sheet with a column for each month. After a year, that sheet is your benchmark.
Sales per day, average ticket and gross margin by category
1. Sales per day
Net sales for the month divided by the days you were open. Months have different numbers of open days, and per-day sales take that out of the comparison. If it drops, the next number tells you whether you made fewer sales or smaller ones. If it falls 2 months in a row against last year, look for what changed: hours, staffing, a best seller that ran out or a quiet marketing calendar.
2. Average ticket
Net sales divided by the number of sales. Count repair pickups and watch batteries separately, or a busy repair month will drag the number down and hide what happened in the cases. If the average ticket falls while the number of sales holds, look at what's in the cases at your main price points and how staff show matching pieces and upgrades.
3. Gross margin by category
Sales minus cost of goods sold, divided by sales, for each category: bridal, diamond fashion, gold, silver, watches, repairs and custom work. A store-wide margin hides problems, because a strong bridal month can cover a weak gold month. When a category's margin slips, look at discounts first: who gave them, how often and how deep.
Watch gold closely this year. Gold traded above $3,000 an ounce for the first time on March 14, 2025, and the World Gold Council expects high prices to create headwinds for gold jewelry demand (World Gold Council, March 17, 2025 (opens in a new tab)). If you price from what you paid, margin on older stock can look fine while the cost to replace each piece keeps climbing. Check older gold pieces against what they would cost to replace today, as well as against what you paid.
Inventory turnover and aged inventory
4. Inventory turnover by category
Cost of goods sold for the last 12 months divided by your average inventory at cost over the same 12 months. Use cost, not retail. Leave out memo and consignment goods, because you don't own them; our guide to memo vs consignment explains the difference.
Categories turn at very different speeds. Loose diamonds, bridal mountings, estate pieces and silver each have their own pace, so compare each category with its own history. A falling turnover means inventory in that category is growing faster than its sales. When that happens, slow your buying in the category before you cut prices, and reorder only proven sellers until the trend turns.
5. Aged inventory at 180 and 365 days
The cost value of pieces in stock more than 180 days, and more than 365 days, as a share of total inventory at cost. Make the list every quarter. Each piece past 365 days gets a decision: reprice it, remount it, return it if your vendor terms allow, melt it, or move it to a sale case.
The list depends on an accurate count. Our year-end inventory count guide walks through counting by case and tray and reconciling pieces that are missing or mis-tagged.
Repair revenue, turnaround and returning customers
6. Repair revenue and turnaround
Track repair and service revenue for the month and the average number of days from intake to ready for pickup. If you can, add the share of jobs finished by the promised date. That last number is the one customers notice. If revenue is up while on-time completion is down, the bench is overloaded: set firmer promised dates, or send simple jobs to a trade shop for a while.
When turnaround slips, check intake before you look at the bench. Clear notes, photos and a signed estimate at the counter, covered in our repair intake checklist, cut down on the phone calls and second estimates that hold jobs up.
7. Returning-customer share
Sales to customers who have bought before, divided by all sales that have a customer attached. Sales with no customer name don't count either way, so the first job is getting a name on more tickets. If the share drops, look at your follow-up: thank-you notes, cleaning invitations and anniversary reminders. Our customer follow-up plan lays out a timeline.
Sales by salesperson, special orders and layaways
8. Sales by salesperson
Net sales, gross margin and average ticket for each person, plus the share of their sales with a customer attached. Look at margin next to volume. A salesperson who discounts to close can lead the store in sales and trail in profit. Use these numbers to coach, and keep the commission plan written down and separate.
9. Special orders and layaways outstanding
The count and total value of open special orders and layaways, with the deposits you hold. Look for orders past their promised date, layaways with no payment in 30 days and deposits on orders the vendor hasn't confirmed. Check this one weekly in November and December, because every line is a promise to a customer. Call the vendor about anything late before the customer calls you.
Online versus in-store sales
10. Online share of sales
Website sales divided by total sales, plus the number of online orders and how many were picked up in store. Count orders reserved online and picked up in the store as online sales, so you can see what the website started.
A website also sends people to the store, which this number doesn't capture. Ask new customers how they found you and note the answer on their record. If online sales stay flat while store sales grow, check that the pieces online match the cases, with current prices and clear photos.
Common mistakes when tracking jewelry store numbers
- Mixing gross and net sales. Pick net sales after returns and discounts, and use it everywhere.
- Including sales tax. Tax isn't your revenue. Leave it out of every number.
- Counting memo goods as inventory. They inflate your inventory and make turnover look worse than it is.
- Counting layaways and special orders too early. Decide whether a sale counts when the deposit is taken or when it's completed, and stick to it. Ask your accountant which fits your books.
- Comparing December with November. A seasonal month only compares with the same month last year.
- Changing definitions midyear. If you change how you count something, restate last year's numbers the same way or note the change in your sheet.
- Sales with no customer attached. They weaken every customer number on the list, so make attaching a customer part of every sale.
How Flawless POS helps you track these numbers
Flawless POS keeps sales, inventory, repairs and customers in one system, so most of these numbers come from the same records instead of separate spreadsheets.
- Reports draw on the same sales and inventory records your staff use at the counter.
- Audit history records every inventory move, so when a count or a turnover number looks wrong, you can trace what happened to a piece.
- Job tracking carries each repair's status and deposit from intake to pickup, which is where turnaround numbers start.
- Special orders and layaways are handled at the register, in the same system as your sales.
- Purchase history on each customer record shows who is coming back.
- Commissions sit in the back office with pay, scheduling and clock in and clock out.
If you're comparing systems, ask every vendor to produce these 10 numbers from its own reports during the demo; our guide on how to choose a jewelry POS has more questions to ask. To see Flawless, book a demo.
See also: Jewelry store management software.
Frequently asked questions
What is a good inventory turnover for a jewelry store?
It depends on your mix. A store heavy in bridal and loose diamonds turns at a different pace from one selling mostly gold and silver fashion. Measure each category against its own number from last year and work on the slowest ones first.
Should gross margin be calculated on cost or replacement cost?
Your books use what you actually paid. For pricing decisions, especially on gold and platinum, also look at what each piece would cost to replace today. When metal prices rise quickly, the gap between cost and replacement cost shows which pieces are underpriced.
How often should we check jewelry store KPIs?
Monthly works for most of these numbers. Check open special orders, layaways and repairs past their promised date every week, because those are promises to customers. Look at the full 12-month trend once a quarter.
Do memo goods count in inventory turnover?
No. Memo and consignment goods belong to the vendor until you buy or sell them, so leave them out of average inventory and track them on their own list. This is general information, not accounting advice, so ask your accountant how your books treat them.